Energy Network Analytics

How would you like to unlock new value in your heating network without having to commit to a major investment?

Energy Network Analytics Energy Network Analytics

Make your heating network more intelligent

How would you like to unlock new value in your heating network without having to commit to a major investment?

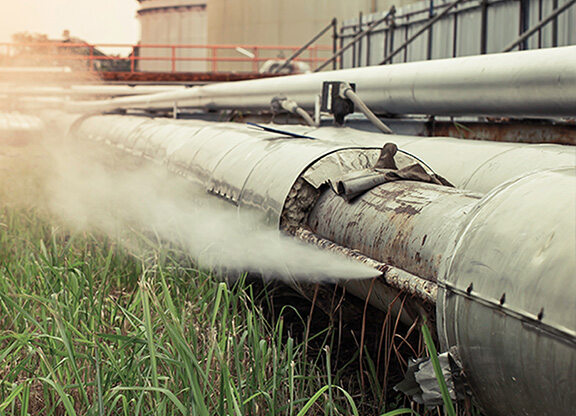
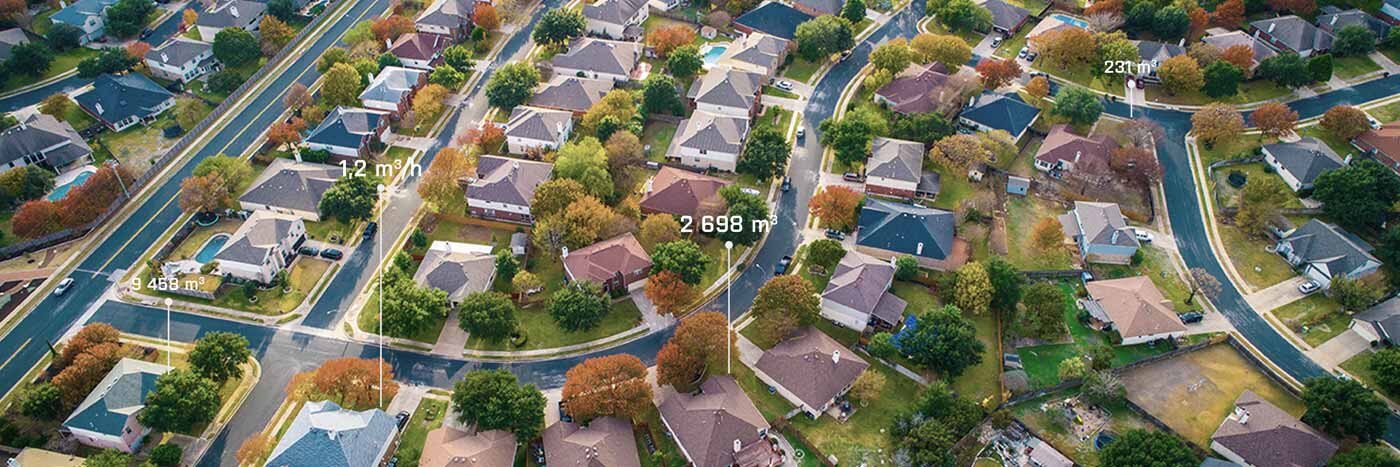
With Diehl Metering's Energy Network Analytics, you transform your heat meter data into valuable network intelligence. Using your existing Diehl Metering smart meters and flow sensors, this powerful solution mines a wealth of information from your system to deliver unique, actionable insights. You’ll get a precise overview of heat distribution and efficiency in your network. You’ll be immediately alerted to any defects or leaks. And you´ll even be able to calculate virtual consumptions by aggregating data from multiple physical sensors. The benefits for your business? Increased network efficiency, reduced costs and higher customer satisfaction.

How does it work?

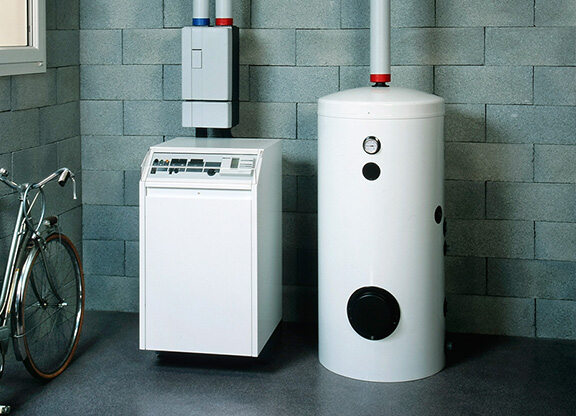
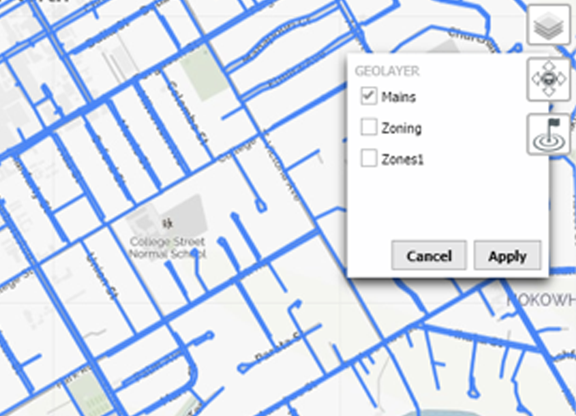
Energy Network Analytics uses communicating heat meters and flow sensors to capture valuable data about individual buildings, individual consumptions and your heat distribution network as a whole. All this information is then transmitted to the powerful Central Data Management software IZAR@NET 2 if hosted locally on your server – or IZAR PLUS PORTAL if you prefer software as a service.

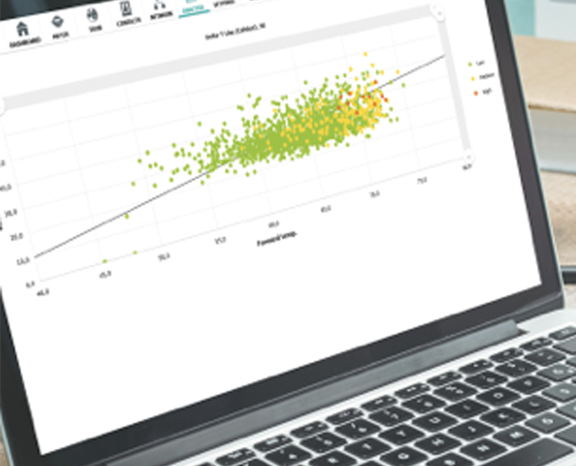
The software interprets the data to deliver a clear dashboard of your system, providing insightful analytics and useful alarms to alert you to anomalies in your heating network. What’s more, IZAR software offers multi-utility and multi-sensor support, allowing you to combine different parts of your business on a single platform.


SWARM ANALYTICS FOR IMPROVED TEMPERATURE SPREAD

With Energy Network Analytics, you can easily identify high return temperatures in your network, potentially caused by defective transfer stations or poor heating patterns. With Swarm Analytics you are able to monitor important system parameters for each heat meter, such as return temperature and spread (Delta T). On the IZAR software platform, you’ll be able to consult charts clustering consumers together according to their consumption class (low, medium or high). And you’ll be able to precisely identify where high return temperatures are occurring and why – empowering you to fix faults quickly or provide consumers with tailored consulting to help them improve their consumption habits.

SMART LEAK DETECTION

Leaks in your distribution network and in buildings can be extremely costly, as well as posing safety risks to consumers. That’s why Energy Network Analytics includes a Smart Leak Detection function. Gathering data from flow sensors and ultrasonic heat meters like SHARKY, Energy Network Analytics evaluates flow rates in your network and prompts alarms if a leak is detected. Within 90 seconds of a pipe bursting, the SHARKY meter will send a notification with precise information about the location and nature of the problem. You can even customize the service to send leak alarms to consumers, helping to grow customer satisfaction.

HEAT DISTRIBUTION OPTIMIZER

Any heat you produce that doesn’t reach consumers means additional cost, wasted energy, and poor sustainability. Heat loss can be caused by aging pipelines or inadequate insulation. The challenge is to know where this is happening in your network – and that’s where Energy Network Analytics comes in. By permanently monitoring flow temperatures at multiple points, it determines the temperature in the pipes to a very high degree of accuracy. Using your IZAR software, you can define your own thresholds for alerts – and you’ll then be immediately notified to signs of heat loss early on in the process. At the same, you’ll be contributing to lowering CO2 emissions.

BOILER EFFICIENCY ANALYSIS

Without regular efficiency monitoring, most boilers operate significantly below their rated efficiencies. That’s why Energy Network Analytics compares the energy brought into your boiler by gas with the thermal energy captured by SHARKY meters. It then calculates the efficiency of the boiler as a percentage relative to the claimed efficiency of the manufacturer. As a result, you’ll have near-real time tracking of your boiler’s efficiency – which means you can monitor it long term and optimize the lifetime costs.

MAP LAYERS FOR A CLEAR OVERVIEW OF YOUR GRID AND DEVICES IN ONE PLACE

One of the key benefits of Energy Network Analytics is that it interprets the masses of data in your network and repackages it in an easy-to-understand format. Map layers offer you a clear overview of your network, allowing you to visualize the precise geographic location of the different devices and meter endpoints in your network – and to pinpoint the places where you need to intervene.

DIGITAL TWIN SIMULATION FOR A CLEARER VIEW

By using multiple meters, you can gather large amounts of data about different parts of your heating network – but that doesn't always give you the big picture. Fortunately, Energy Network Analytics has the answer. By collecting data from numerous neighboring devices, it can create virtual meters that calculate consumption values for a given building, group of buildings, or any sub-section of your network. You’ll be able to monitor overall energy efficiency even more accurately and identify more opportunities for cost savings. You can even generate new business by reselling virtual meter analyses to third parties.

More information

Contact us for a personalised analysis of your needs.

Customer cases

  • Bronderslev

    Bronderslev Bronderslev

    As a pioneer in the field of smart energy Brønderslev Forsyning A/S is implementing a “District Heating of the Future” concept: power and district heating supply is generated in its own combined heat and power unit which is one of the most efficient plants worldwide due to the combination of solar, biomass and heat pumps.

    Read more
  • Støvring

    Støvring Støvring

    Støvring Kraftvarmeværk a.m.b.a. is a typical Danish district heating company. The utility is publicly owned and supplies district heating to the small town of Støvring. Through its 64 km network of main pipelines, it serves more than 2,600 households. The company has its own thermal power plant, which features a unique architecture, and uses three gas engines to produce electricity and 65,000 MWh of heat annually. 

    Read more